
TradingView Projects
TradingView projects I've built from the ground up
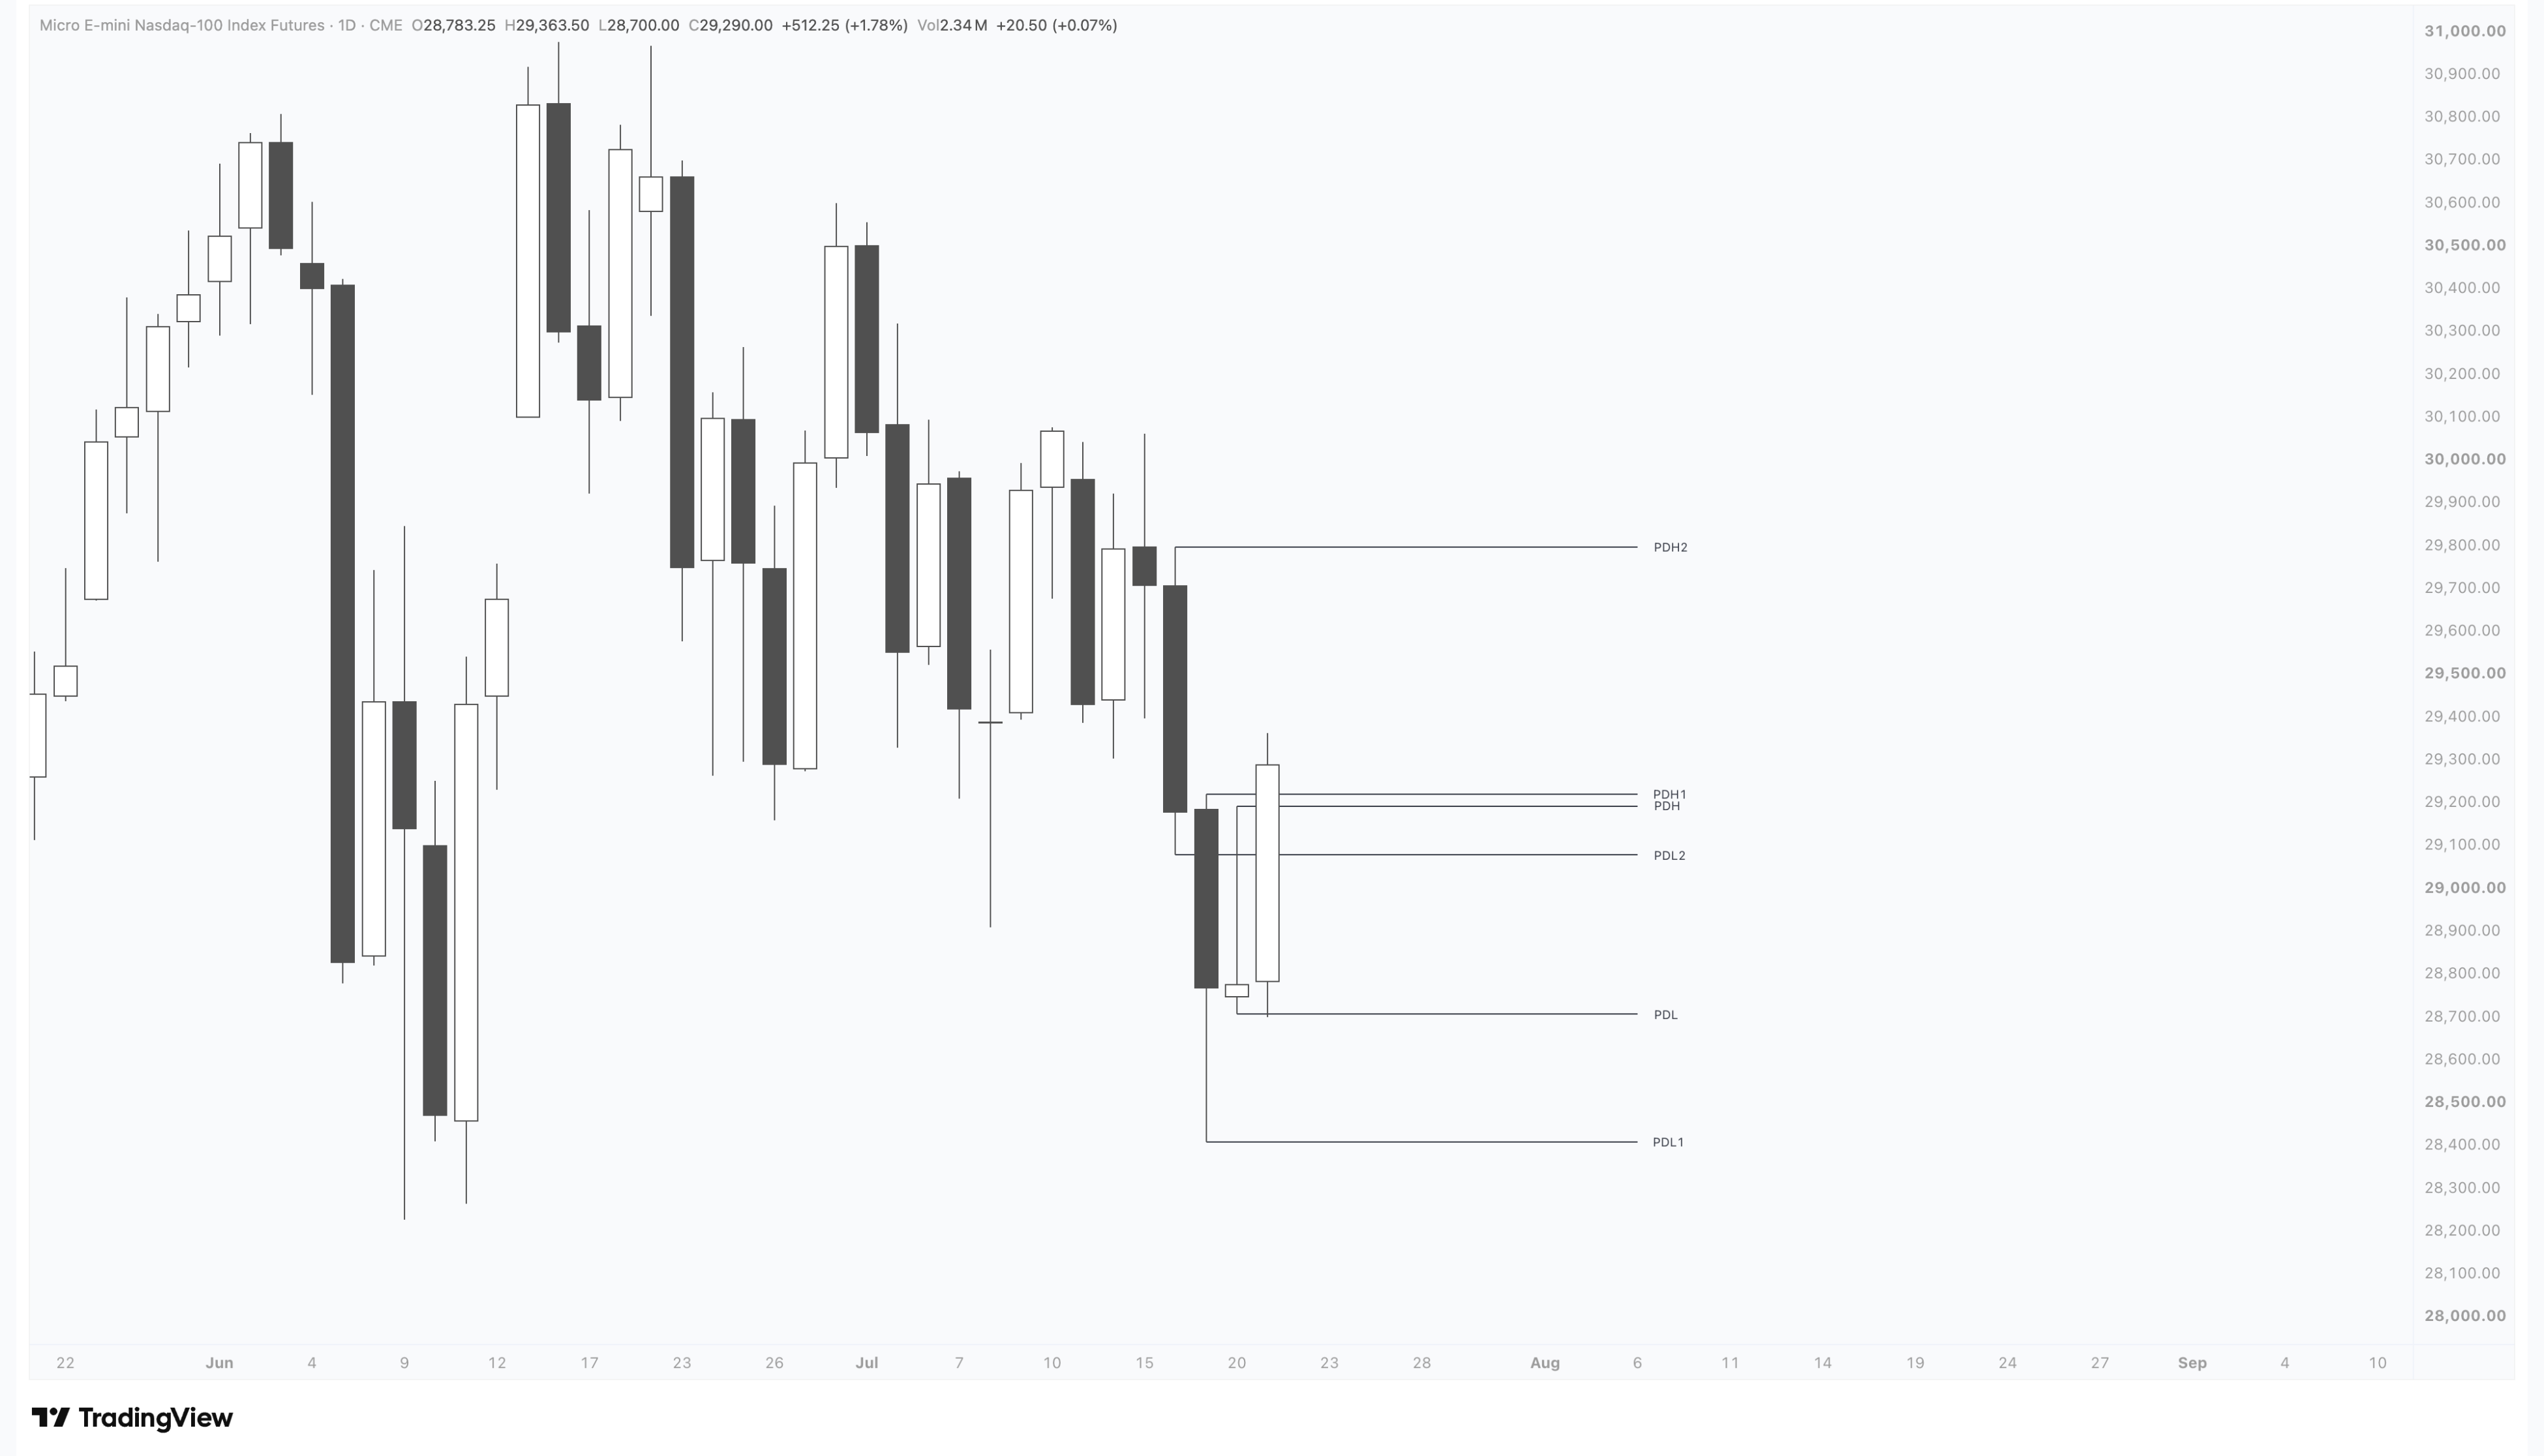
This indicator plots current day high/low and previous day highs/lows. It can be cumbersome to mark out daily highs/lows when checking for daily swing points and closures every day. This indicator simplifies that process by marking these levels out automatically. All levels can be seen on the daily timeframe and lower timeframes.
PineScript v6
TradingView
Futures
Nasdaq
S&P 500
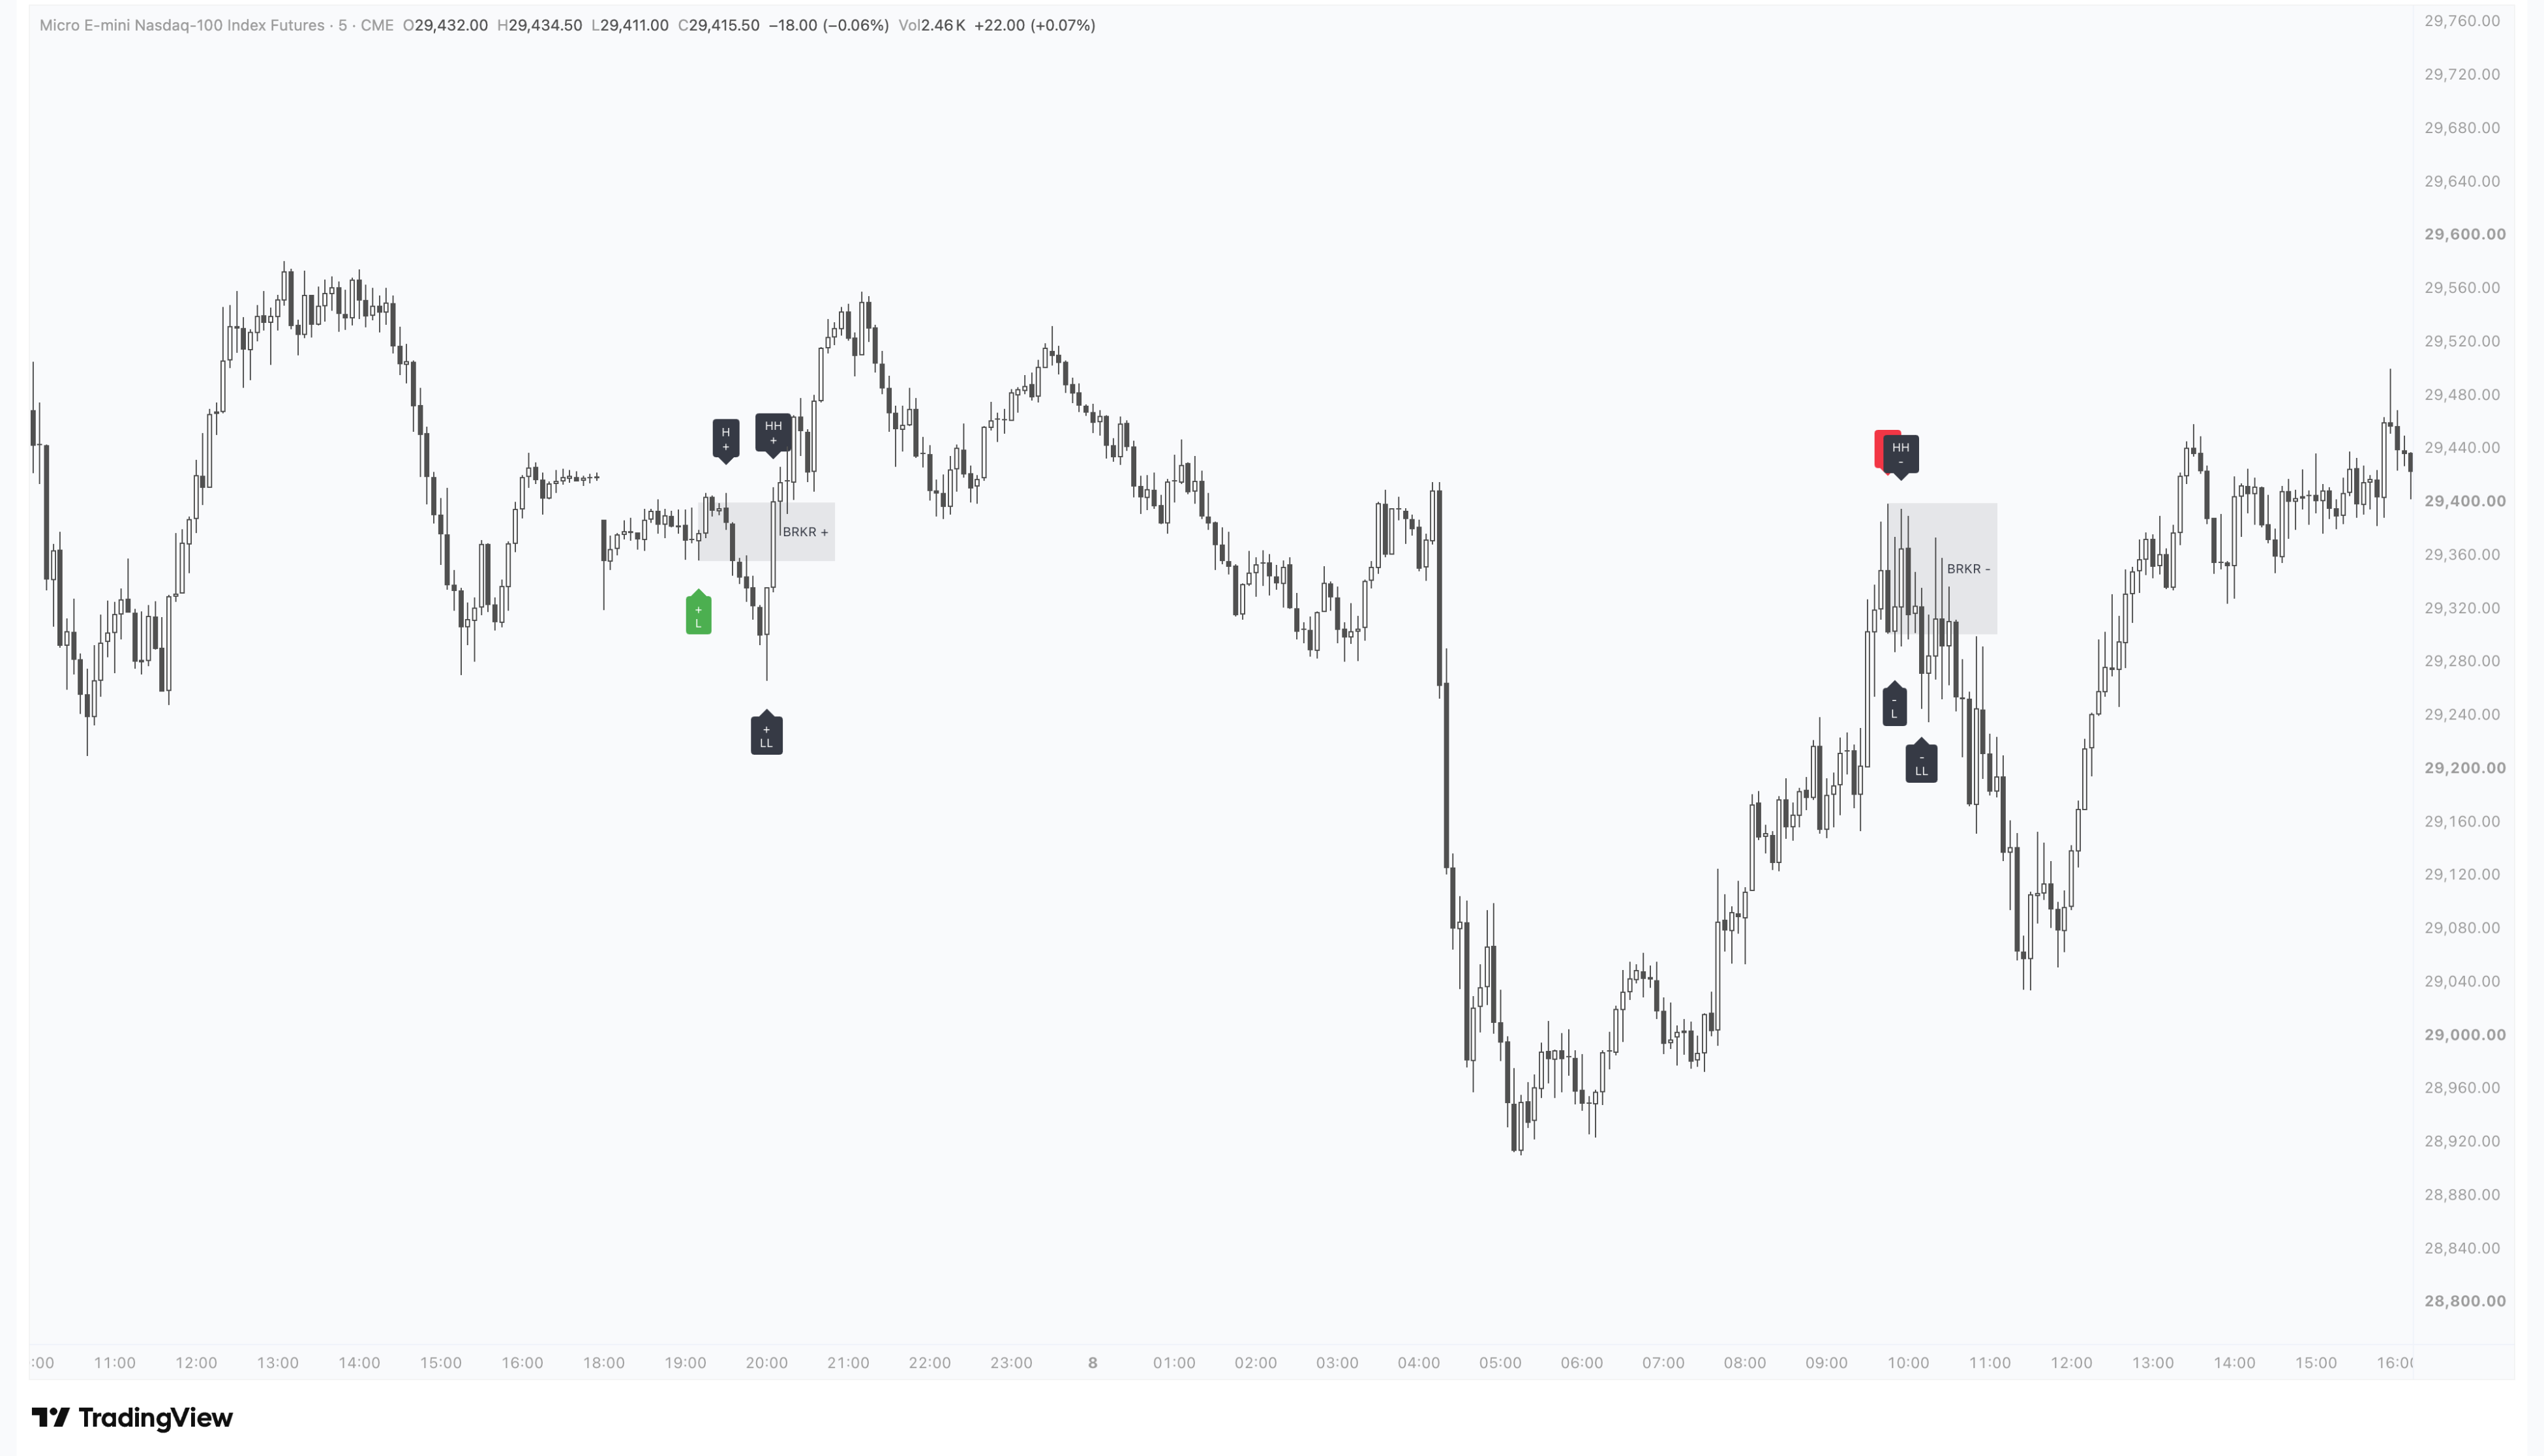
This indicator plots bullish and bearish breaker formations. When price is moving quickly, it can be difficult to mark out breaker formations across multiple timeframes. This indicator simplifies that process by marking these out automatically -- ultimately making the formations easily visible.
PineScript v6
TradingView
Futures
Nasdaq
S&P 500
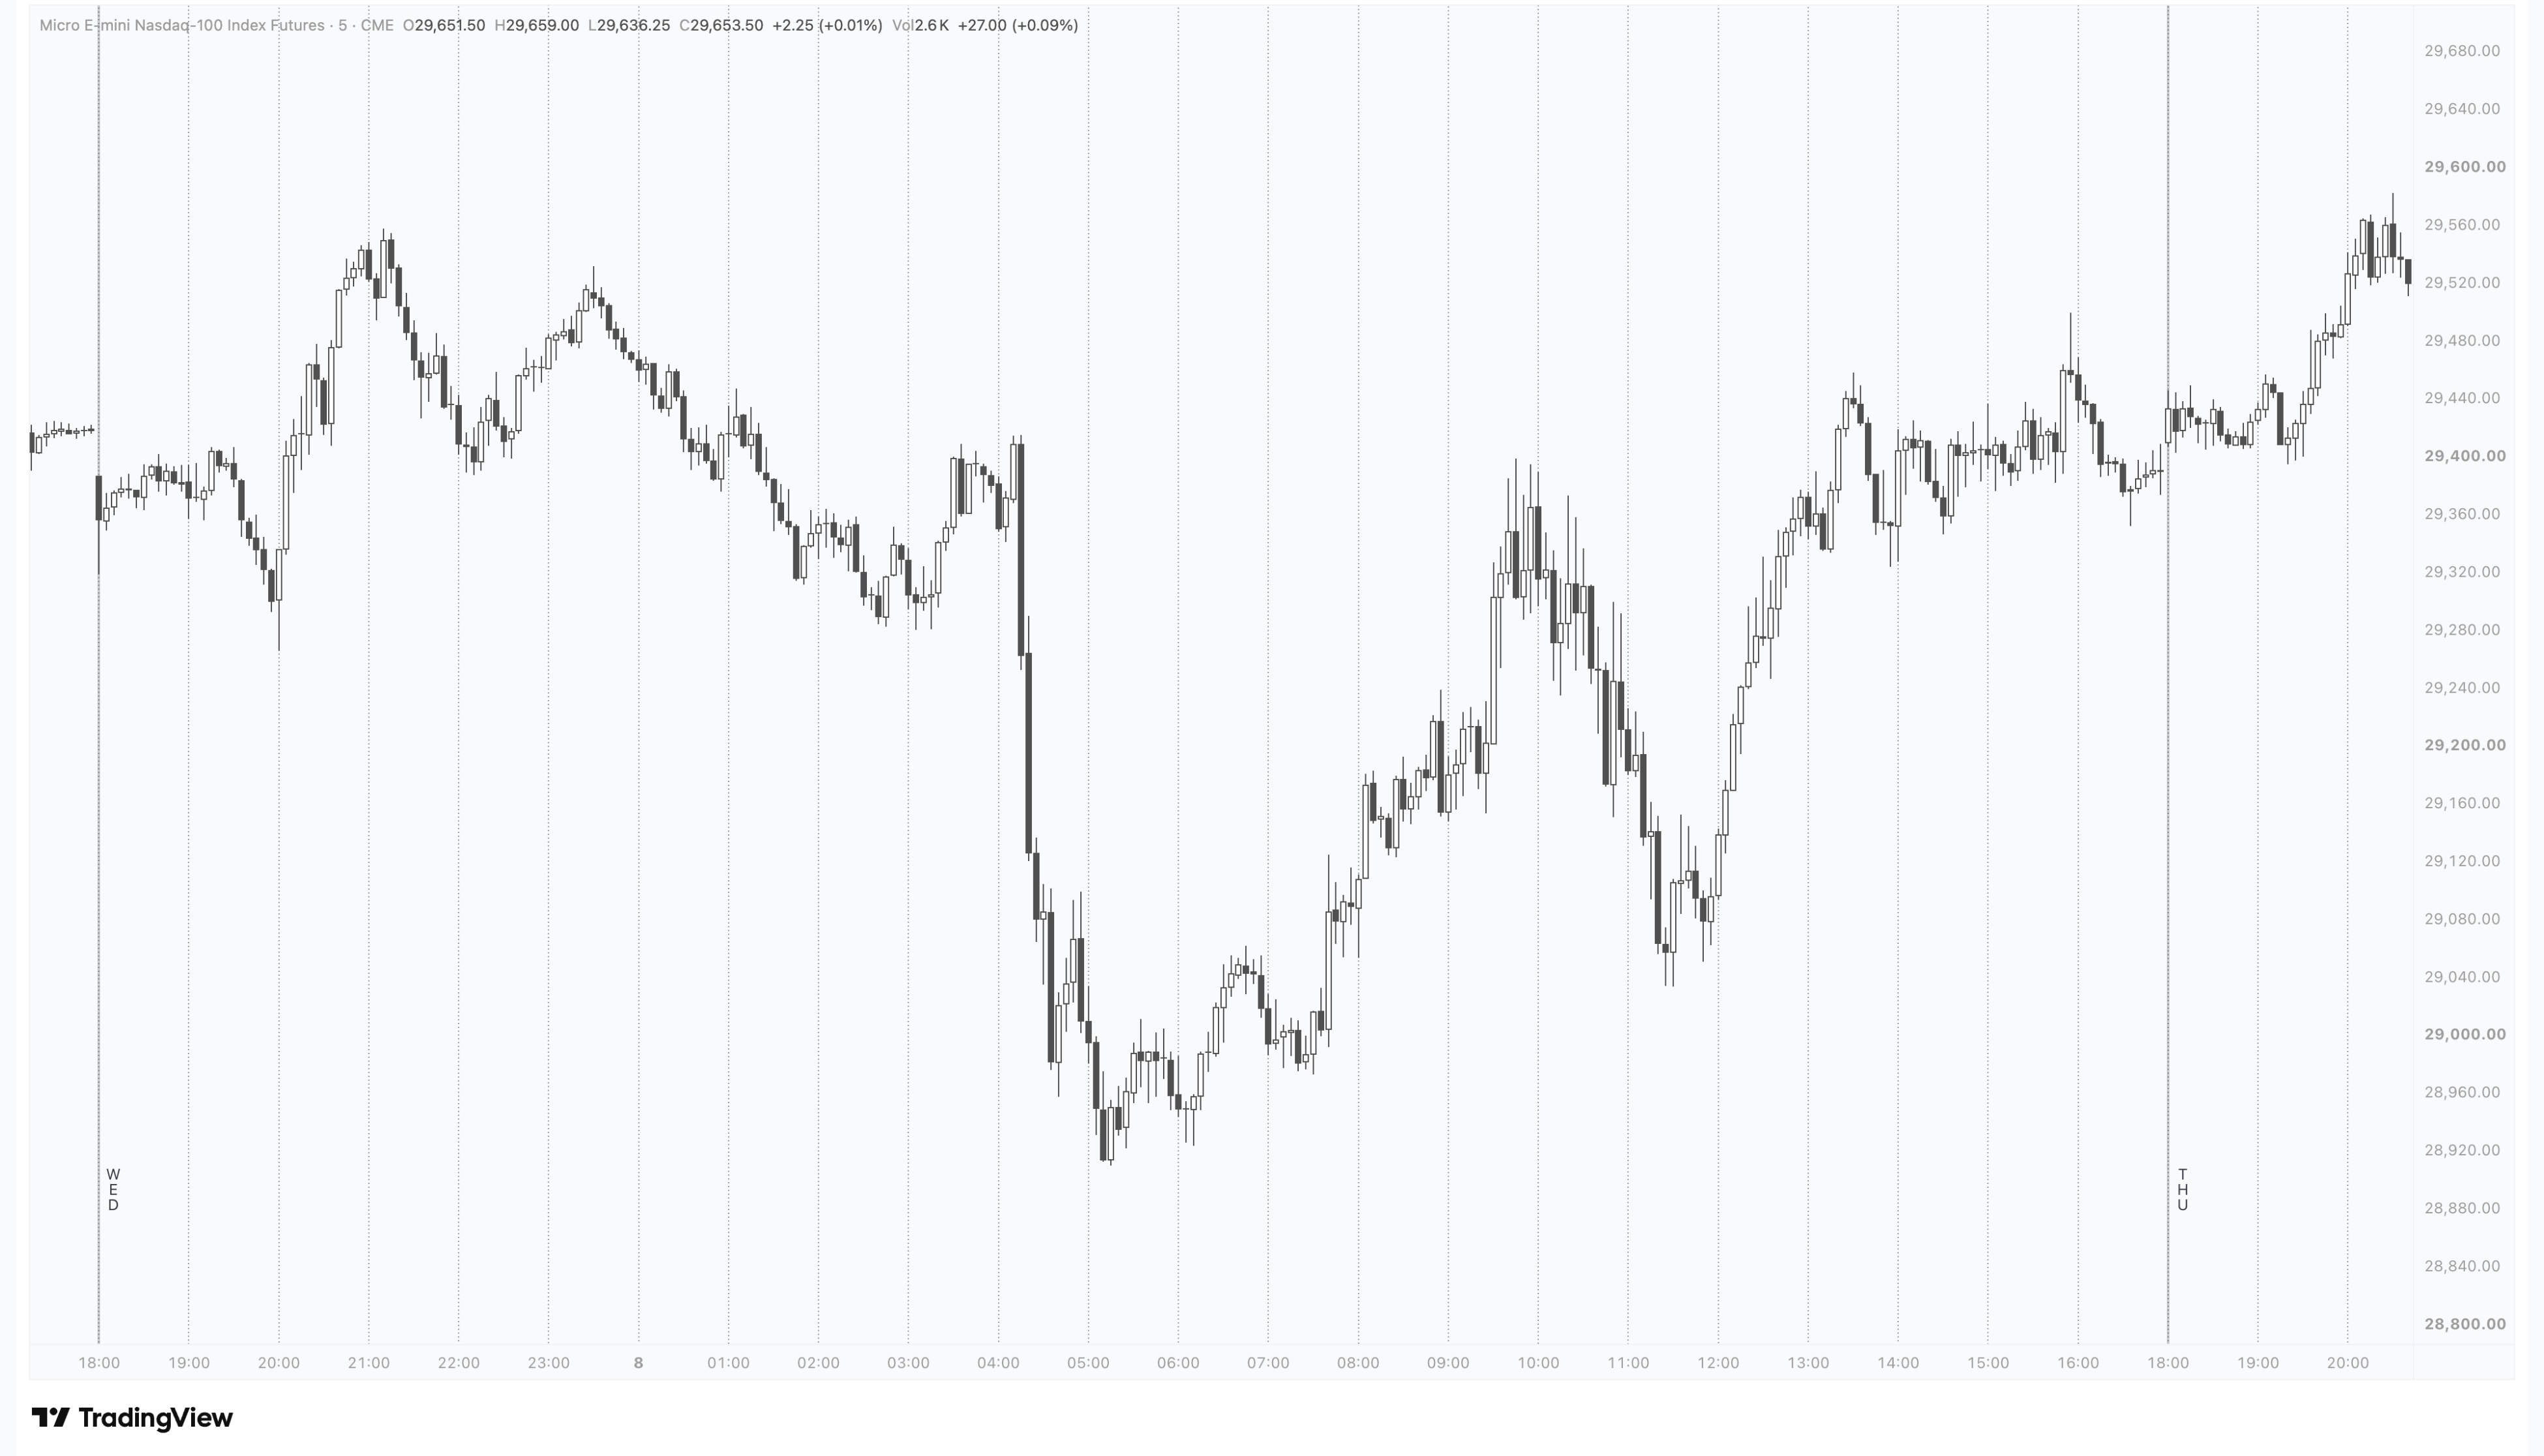
This indicator draws vertical lines at higher-timeframe candle intervals—for example, a 5-minute chart shows a line every hour, and a 15-minute chart shows a line every 4 hours. This lets you zoom into a lower timeframe and easily see where the higher timeframe's OHLC is located. Current configurations are: 1m/15m, 5m/1h, 15m/4h, 1h/1d.
PineScript v6
TradingView
Futures
Nasdaq
S&P 500
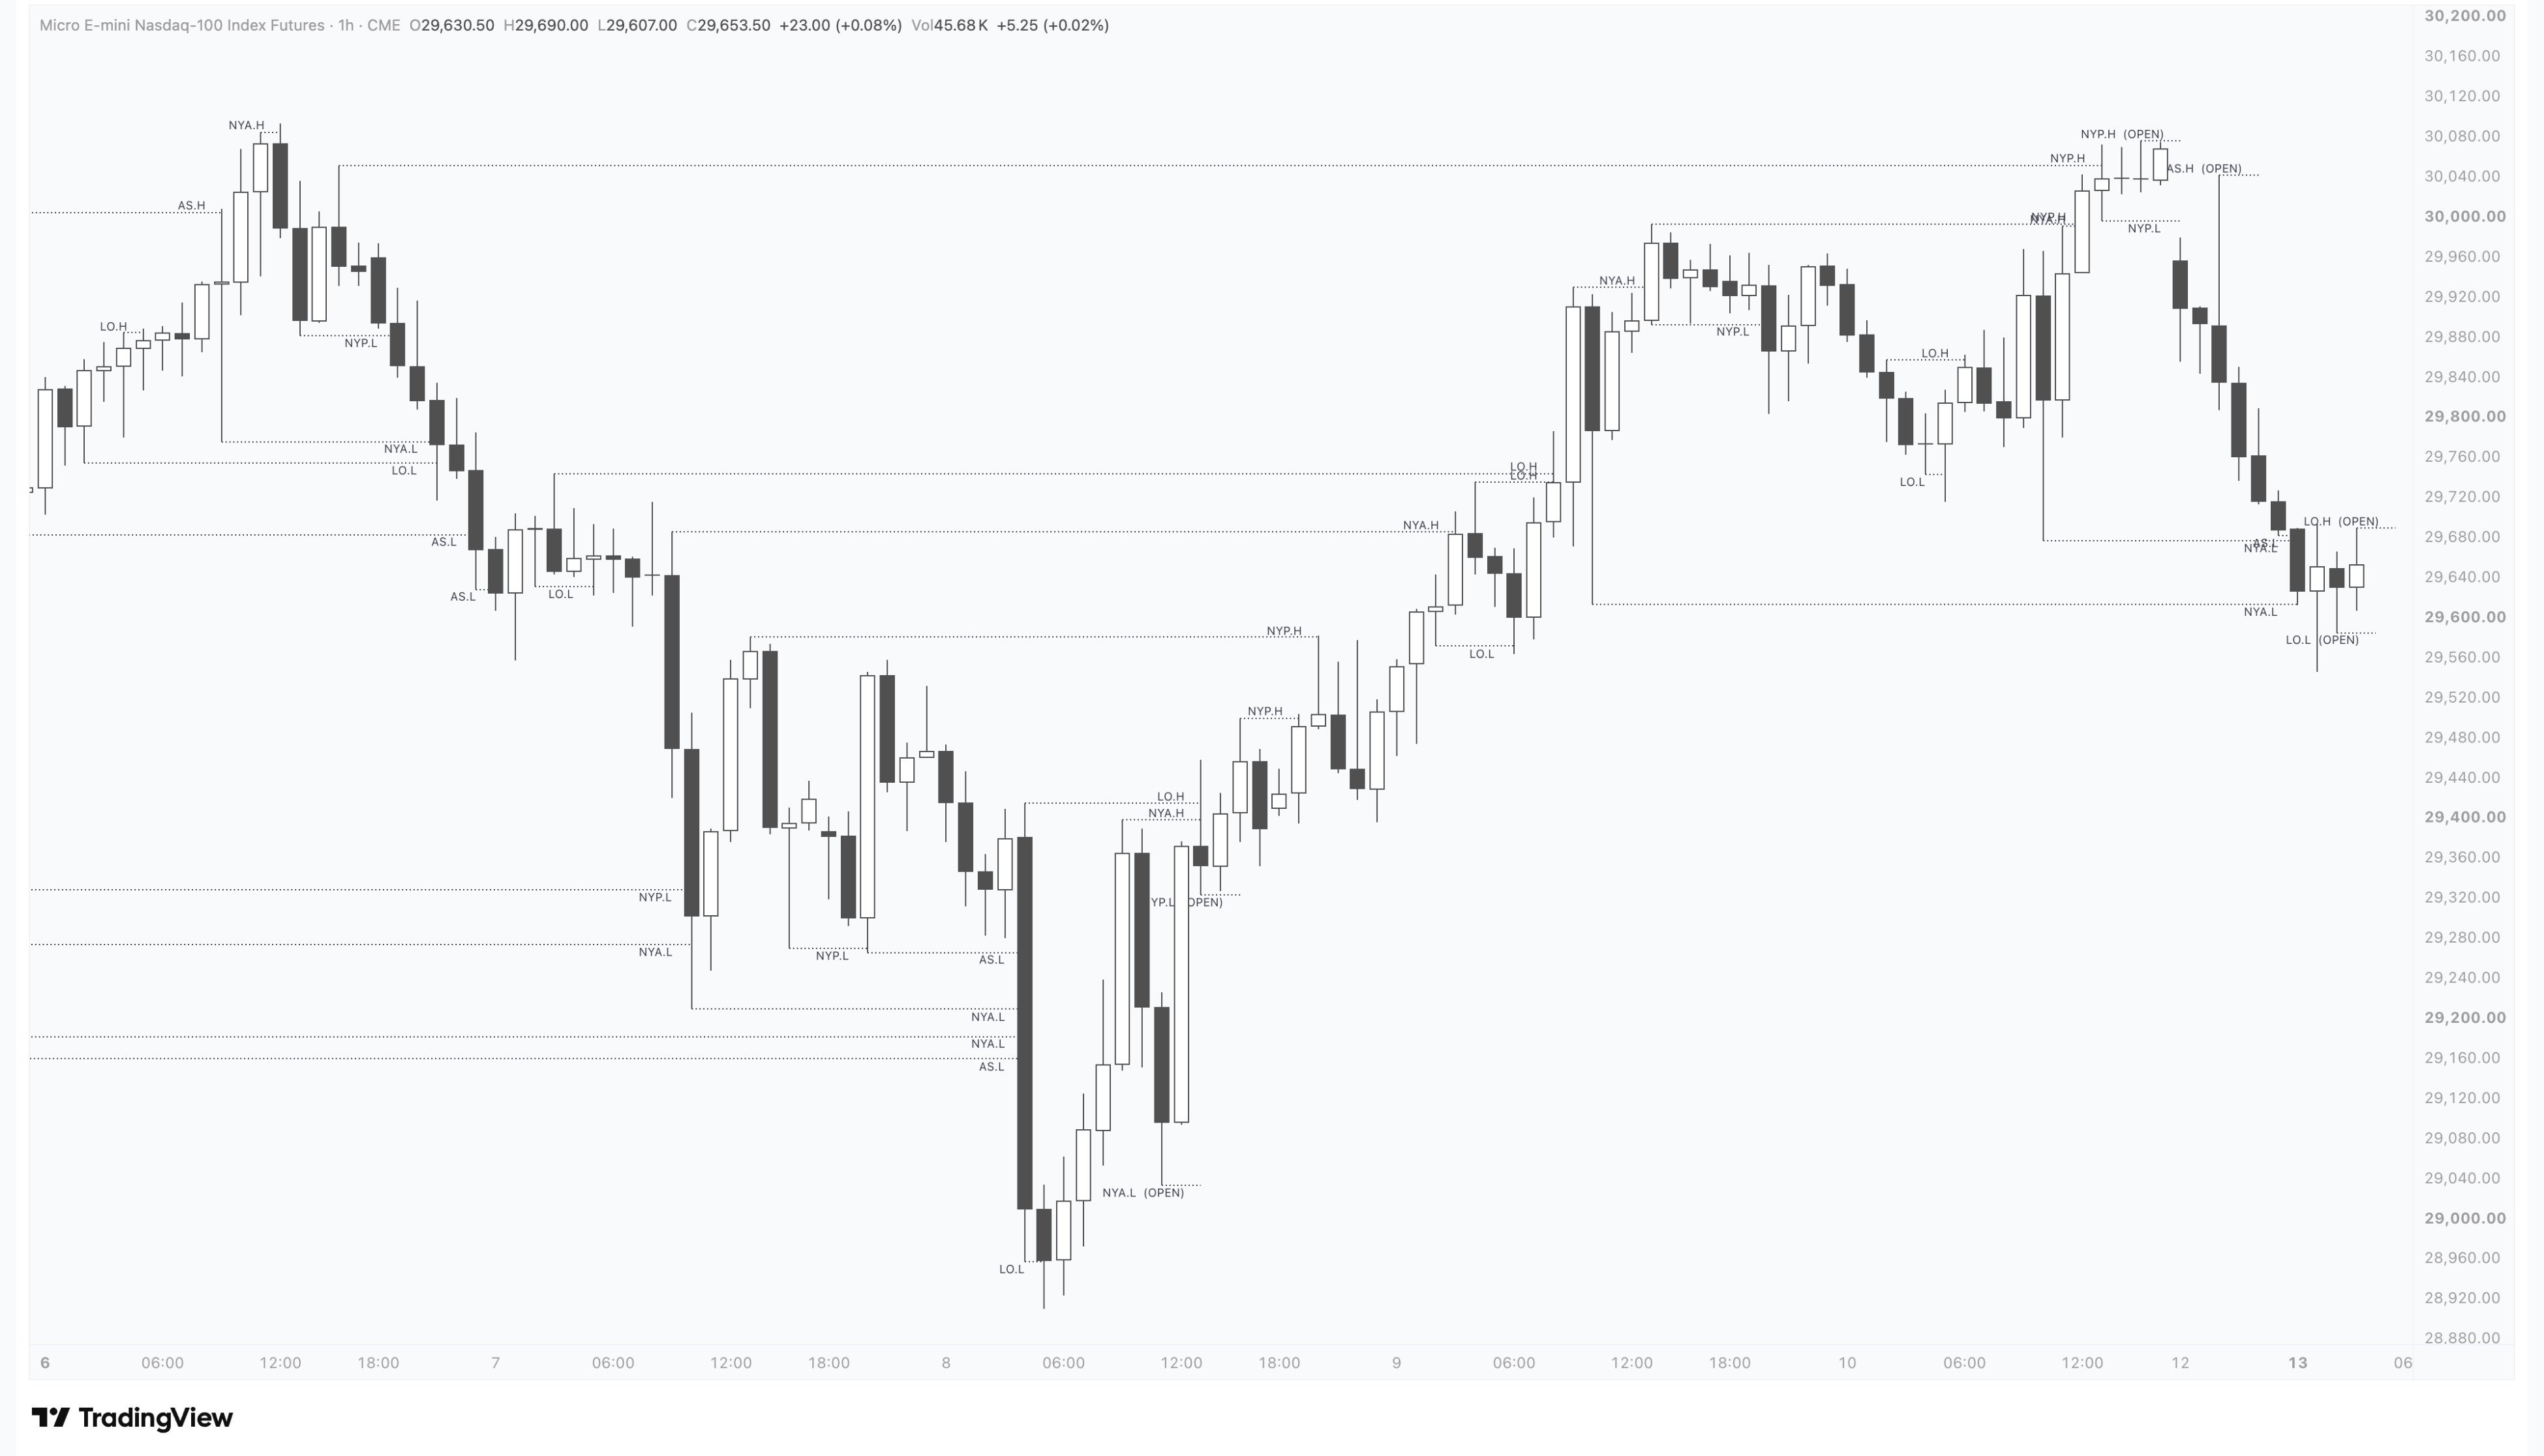
This indicator plots session highs and lows as draws on liquidity (DOL). It includes Asia High/Low, London High/Low, NY AM High/Low, and NY PM High/Low. Open highs and lows are marked with an OPEN suffix. Once price moves through a session high or low, the line is extended and the OPEN suffix is removed, indicating that the DOL was taken.
PineScript v6
TradingView
Futures
Nasdaq
S&P 500