
The Weekly Close: Sharing a Week of Trading Results
A browser tool that turns a week of trading results into a chart you can share.
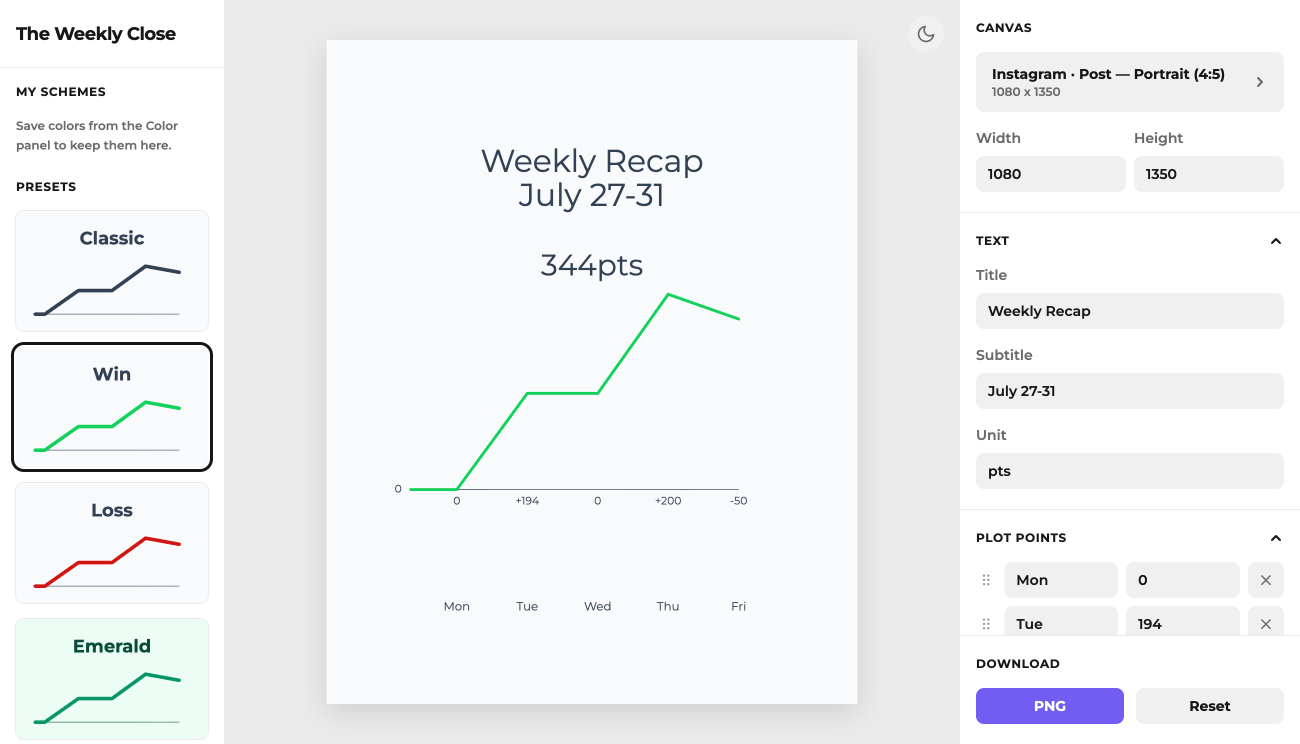 The Weekly Close
The Weekly Close is a browser tool that turns a week of trading results into a chart you can share. It's the same tool I use for my @sctb_eric posts.
How It Works#
You enter a value for each day (the default week is Monday through Friday), and it draws a cumulative line. The line starts at a fixed zero axis, each point shows its change from the one before it, and the total for the week sits at the top.
What You Can Change#
- Text: the title, subtitle, and unit
- Plot points: drag or use the arrow keys to reorder them, and use the arrow keys to step values up or down
- Line style: straight or curved
- Colors: pick a preset, set your own colors, add a background or line gradient, and save your color schemes under "My Schemes"
- Size: presets for Instagram, TikTok, iPhone, Android, X, LinkedIn, and YouTube, or custom dimensions
When it looks right, export it as a PNG. Your settings and theme are saved in your browser's local storage, so they're there the next time you open it.
Links#
tradingnext.jsopen sourceclaude